Mapcolorizer.js: Choropleth maps with Leaflet
November 2013
I've had an interest to interactive maps for a long time and always wanted to do something nice and useful with them. When I discovered this choropleth demo of Leaflet, I knew I had to make something similar of Finland.
Many of the 320 communes in Finland are small and currently struggling economically. Discussion of merges are in the air. Putting together opensource tools and open statistical data, my aim was to visualize the situation and contribute opensource code along the way.
Leaflet seemed a solid solution but I did try other tech too. Google Maps had some flicker with large polygon count, and I wanted to experiment with open tile servers anyway. Opensource alternatives are many ( OpenLayers, ModestMaps, PolyMaps, KartoGraph ) but they didn't provide the same level of featurefulness and modern approach as Leaflet. In the end, it was easy to pick Leaflet.
My work produced two deliverables: a jQuery plugin and a site visualizing the communes of Finland.
Mapcolorizer.js
Mapcolorizer.js is a jQuery plugin that takes in polygon data as GeoJSON, statistical data as JSON and then colorizes the polygons on top of a map, relying on Leaflet base functionality.
Usage is as simple as this:
var options = {url_geoson: "data/kuntarajat.geojson"};
var map = $("#map1").mapcolorizer(options).data("mapcolorizer");
map.init(function() {
    map.loadData("data/2014-statistics.json");
    map.setTileServer("mapquest");
});
Check the instructions and API in GitHub README.
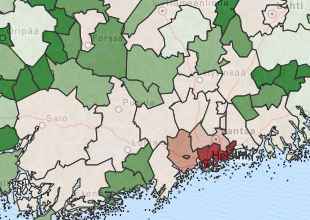
Kuntakartta.org demo
kuntakartta.org is a site that visualizes various statistical data of Finland's 320 communes. Commune polygons were converted from a published .KML file, and statistical data was gathered from 2 places, converted from raw to JSON with the help of a simple Python script. If you know Finnish, there is some talk of data and examples in the site.
I took the base HTML template from html5boilerplate even though there is some extra stuff not needed. Bootstrap would have been overkill.
Used HTML5 drag'n'drop and FileReader features for letting the user drop a local user authored JSON data file on map and see it visualized.
Since there is no app server requirement, kuntakartta.org is hosted by GitHub pages.
Github Pages
This was my first project to use GitHub pages and I must say I'm impressed. Such an easy way for a developer to publish a static frontend for an opensource project!
The steps to create a site are simple. When your actual project is finished and commited to GitHub, do this and you'll a have site in a few minutes:
git clone https://github.com/user/repository.git
cd repository
git checkout --orphan gh-pages
git rm -rf .
# copy your site files...
git add
git commit
git git push origin gh-pages
Since the GeoJSON file of Finland is 1MB in size, I was a little worried about host load. I investigated the limits and found an answer where they say that unless I do a massive porn site, there shouldn't be a problem. Most likely the load of my site stays low enough to be under radar.
The files served by GitHub are GZipped, have an Expires header of 10 minutes, and implement ETags. Pretty solid.
Markdown Preview
While writing the README.md, or any Markdown text, you need to see the preview of the HTML before commiting text. I used a nice Chrome extension Markdown Preview Plus for this job. It even supports GitHub flavored Markdown. Recommended.
Choro?
Yeah, I know, pretty scientific name for coloring stuff. Go read on Wikipedia.
Back